
Short on time? Download the original PDF HERE and review it at your convenience!
Executive Summary
The outbreak of US and Israeli military strikes on Iran on 28 February 2026 triggered the most significant surge in New Zealand fuel price coverage in recent memory. Over the 14-day monitoring period, Truescope recorded 2,811 items across New Zealand news media, generating a combined audience reach of approximately 871.8 million impressions. Sentiment was overwhelmingly and persistently negative, with a net polarised sentiment score of -100 on most days of the period — a finding that reflects the gravity with which New Zealand journalists, economists, industry bodies, and consumers framed the unfolding energy shock.
The coverage was characterised by four interlocking narrative threads:
- The mechanics of the Strait of Hormuz disruption and its direct transmission to New Zealand pump prices.
- The cascading inflationary consequences for households and businesses.
- The government's policy response, including the formation of a new ministerial oversight group.
- The broader question of whether New Zealand's fuel supply security was adequate for a prolonged crisis.
Across all media types, the Strait of Hormuz emerged as the single most important explanatory concept in the coverage, cited in virtually every substantive article as the chokepoint through which approximately 20% of the world's oil supply normally passes.
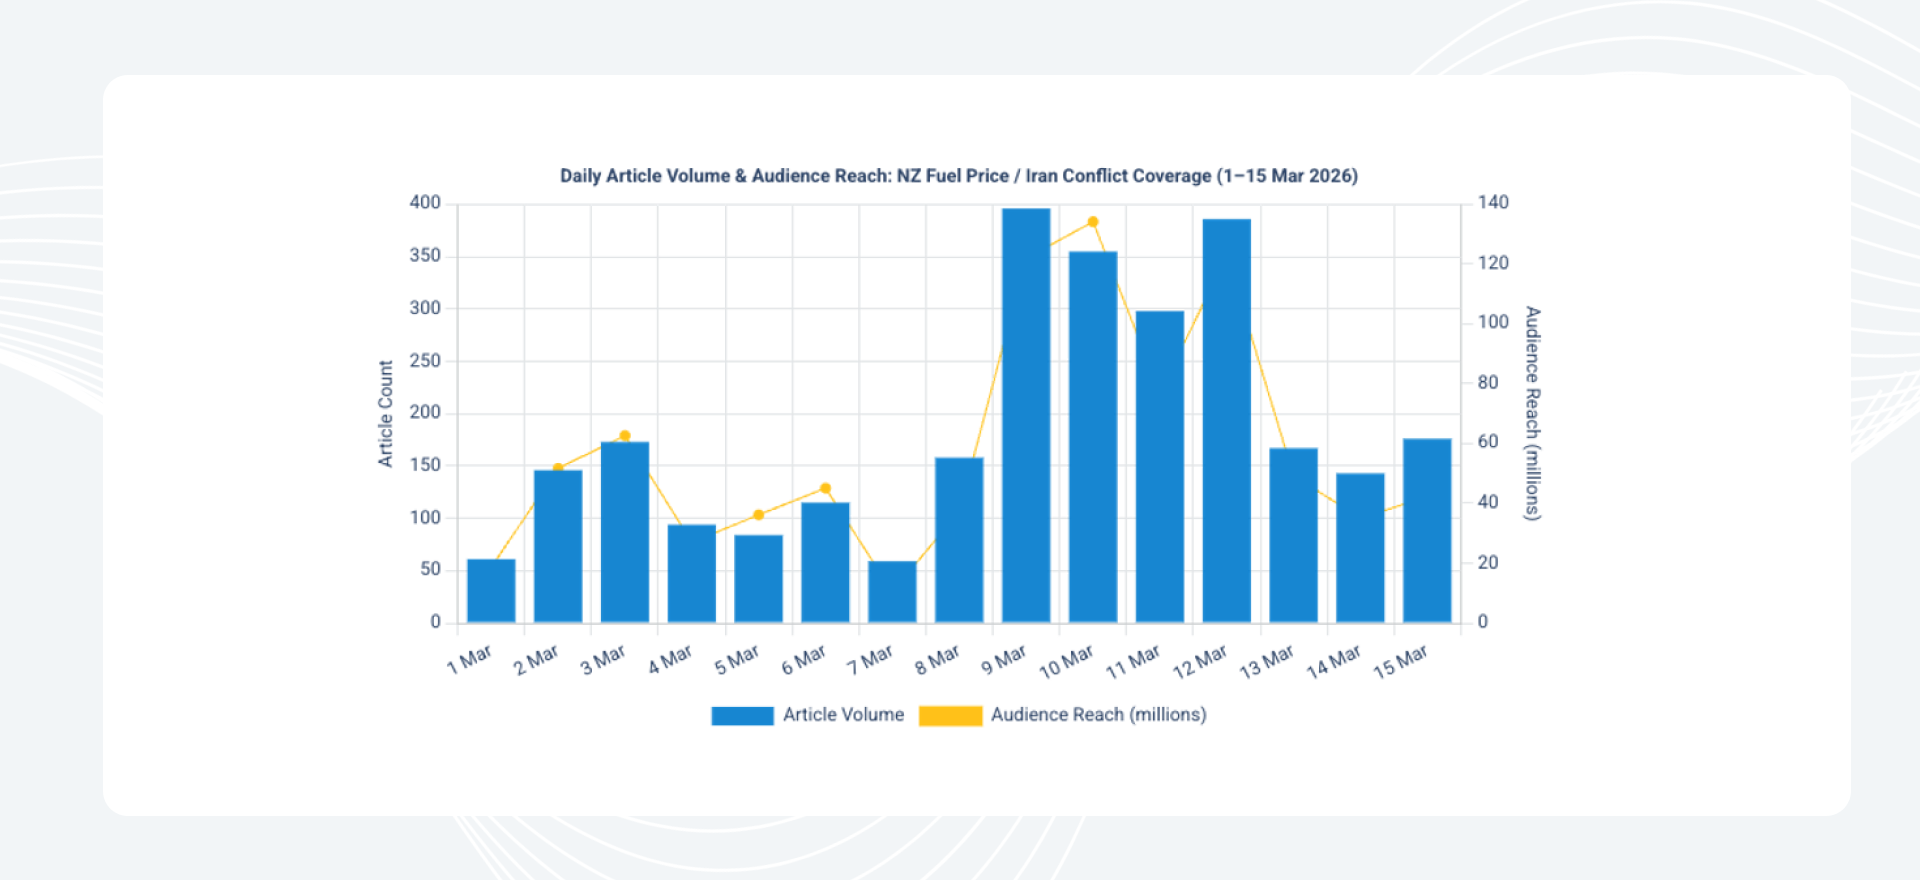
1. Volume & Audience Reach: Daily Time Series
The daily volume data reveals a clear and dramatic escalation pattern, beginning with modest coverage in the first days of March before surging to peak volumes in the 9–12 March window, coinciding with oil prices breaking through the US$100 per barrel threshold for the first time since 2022.
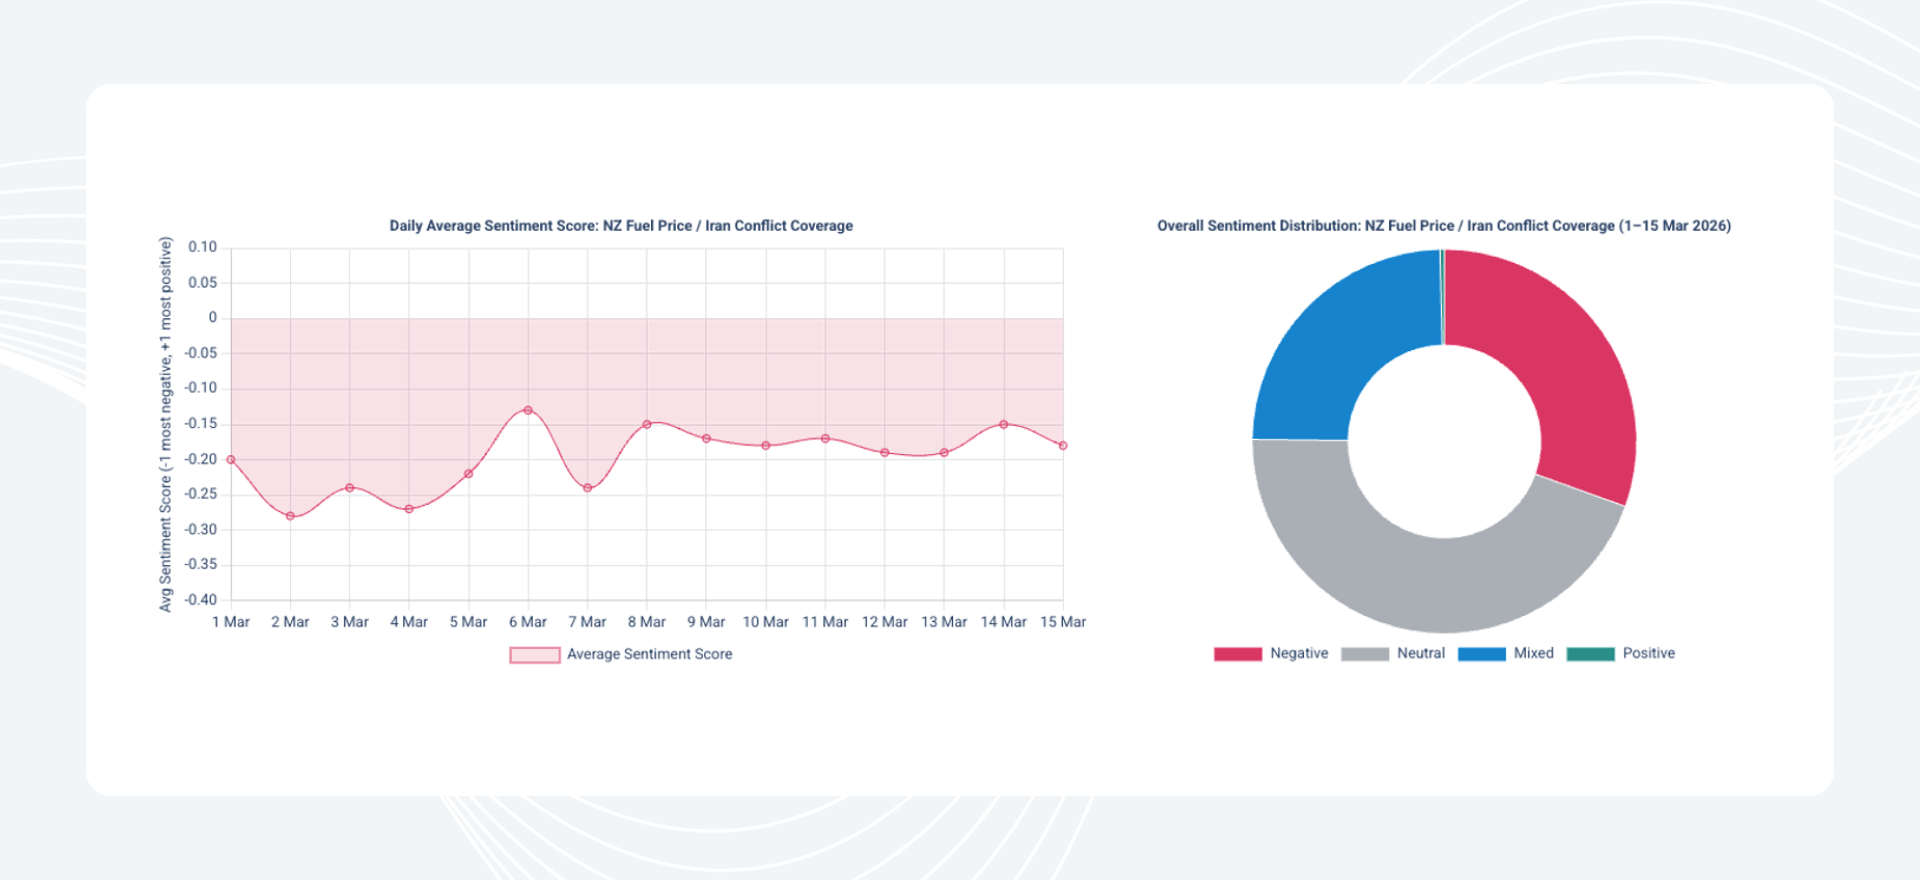
2. Sentiment Analysis
Sentiment across the entire monitoring period was strikingly and consistently negative. The net polarised sentiment score was -100 on ten of the fifteen days monitored, with only marginal positive sentiment appearing on six days - and even then, positive items represented a tiny fraction of total coverage. The average sentiment score across the period ranged from approximately -0.13 to -0.28 on a scale of -1.0 to +1.0, indicating strongly negative framing throughout.
3. Key Narratives & Thematic Analysis
Narrative 1: The Strait of Hormuz as New Zealand's Achilles Heel
The single most dominant explanatory framework across all coverage was the Strait of Hormuz, the 33-kilometre-wide chokepoint between the Persian Gulf and the Gulf of Oman through which approximately 20% of the world's daily oil supply passes. This figure was cited with remarkable consistency across virtually every substantive article in the dataset, functioning as a kind of shorthand for New Zealand's vulnerability to geopolitical events thousands of kilometres away.
Narrative 2: The Price Escalation Story
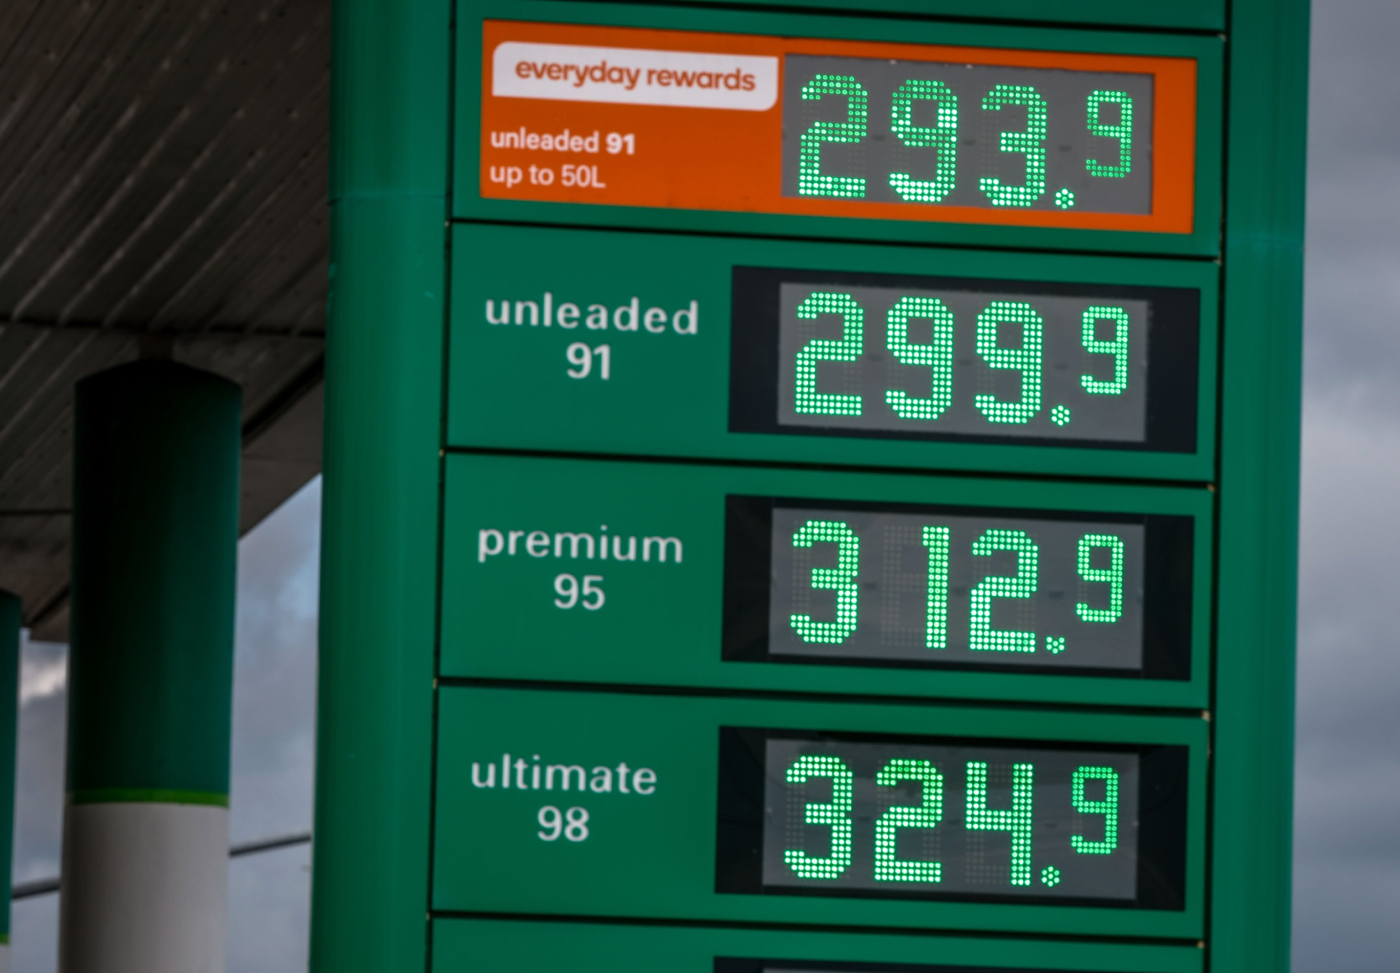
The coverage tracked a rapid and dramatic escalation in actual pump prices, with the narrative moving from early warnings of potential rises to confirmed price increases, then to the psychological threshold of $3 per litre, and ultimately to speculation about whether $4 per litre was possible.
Narrative 3: Cascading Economic Consequences — Inflation, Freight, and Air Travel
A significant strand of coverage moved beyond the immediate pump price story to examine the broader economic transmission channels through which the oil shock would affect New Zealand households and businesses. This narrative was particularly prominent in business-focused outlets and from the second week of the monitoring period onwards.
Narrative 4: Government Response and Regulatory Oversight
From approximately 9 March onwards, a distinct narrative strand emerged around the government's response to the crisis, encompassing the Commerce Commission's monitoring role, the formation of a new ministerial oversight group, and the IEA's strategic reserve release.
4. Top Authors & Journalists
The following table presents the top journalists by volume of coverage, excluding generic or non-attributed bylines. All sentiment scores are on a scale of -1.0 (most negative) to +1.0 (most positive).
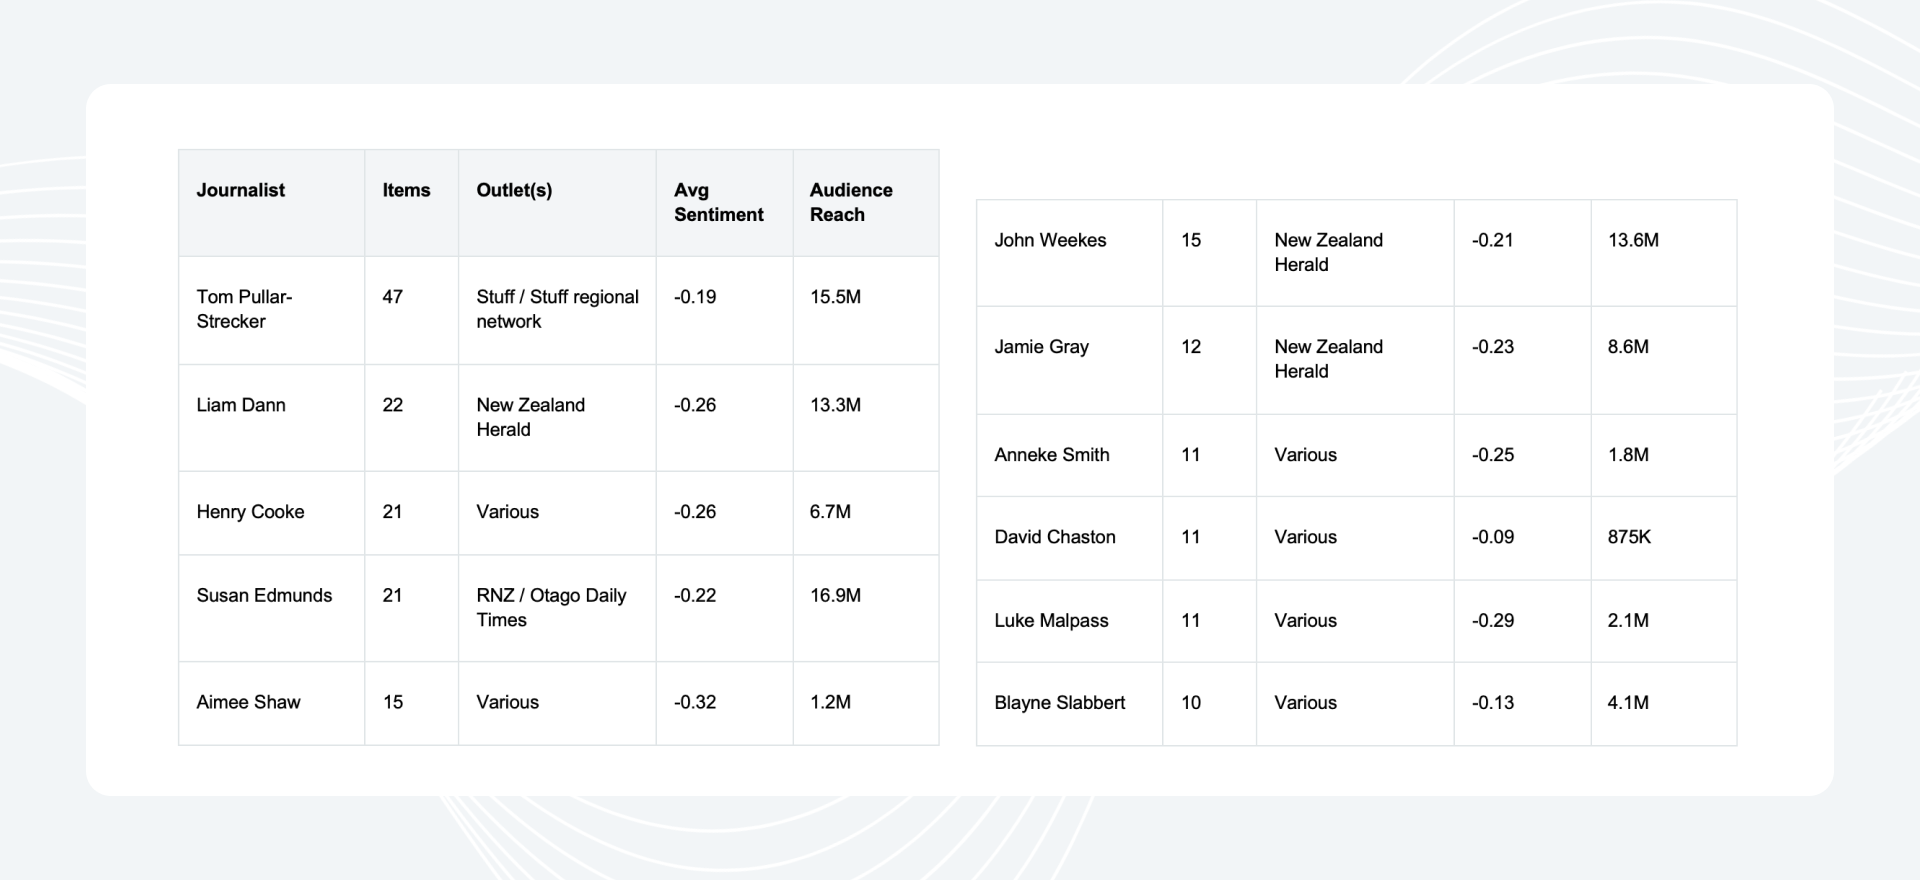
Tom Pullar-Strecker was the most prolific journalist on this topic, with 47 items and a combined audience reach of 15.5 million. His coverage was distributed across the Stuff regional network, with his "Petrol price shock could be a big one" analysis syndicated to at least six regional titles.
Liam Dann of the New Zealand Herald produced 22 items with a combined reach of 13.3 million, and was notable for being among the first journalists to frame the story in terms of its broader economic implications for New Zealand's recovery.
Susan Edmunds, working across RNZ and the Otago Daily Times, produced 21 items with a combined reach of 16.9 million. Her RNZ reporting was particularly notable for its consumer-facing focus, including the widely-cited piece on petrol prices crossing $3 per litre at Kapiti Coast outlets.
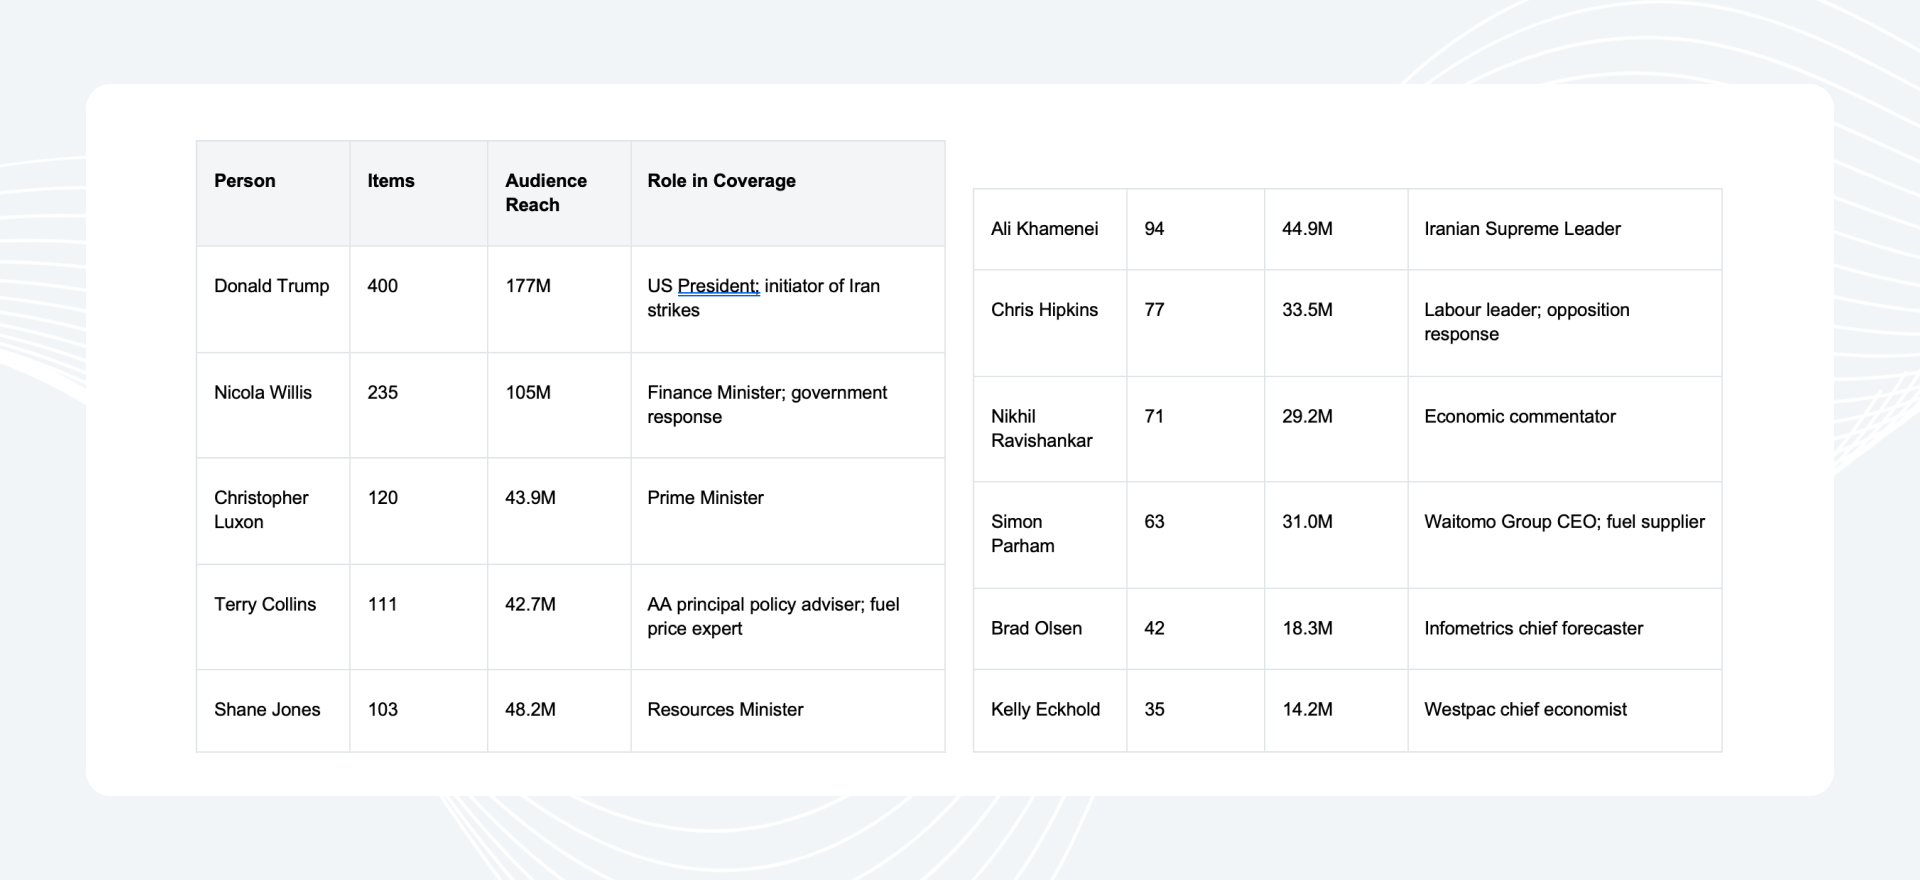
5. Key Entities & Voices Most-Cited People
Terry Collins of the AA emerged as the dominant expert voice in the coverage, cited across virtually every major outlet throughout the period. His consistent, accessible commentary, translating complex oil market movements into simple per-litre pump price implications made him the go-to source for journalists seeking to explain the story to general audiences.
Simon Parham, chief executive of Waitomo Group, was another frequently cited industry voice, offering a fuel supplier's perspective on the crisis. Parham told media that the pressure on oil prices was "going to go months, not weeks," and that shipping traffic through the Strait of Hormuz "had largely halted."
Brad Olsen of Infometrics was cited in early coverage as warning that "higher oil prices and refining margins could see pump prices for 91 unleaded rising to around $2.85/litre," and that if sustained, this "would directly add around 0.5 percentage points to annual inflation this year."
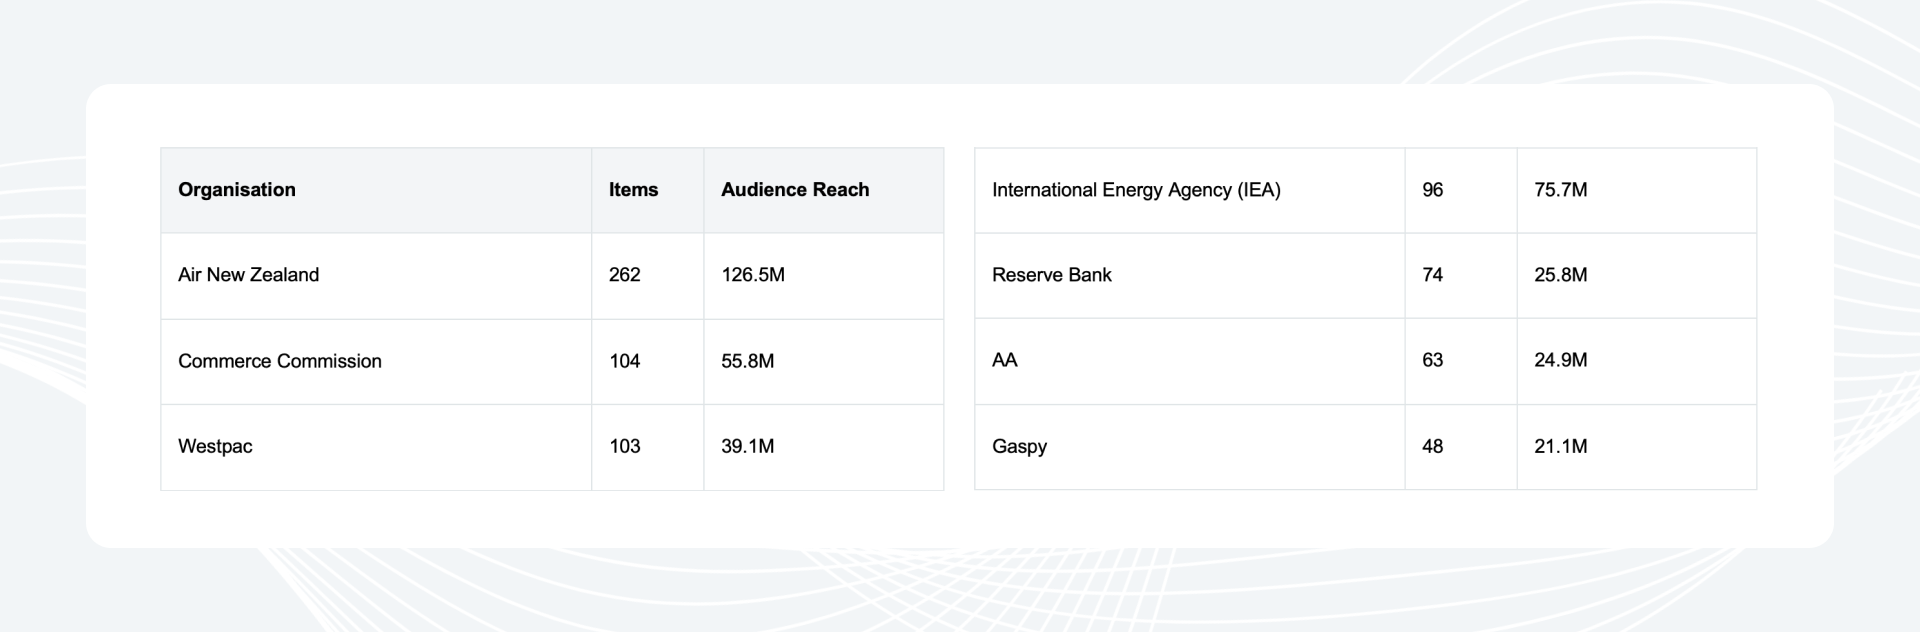
Most-Cited Organisations
Air New Zealand's prominence (262 items, 126.5M reach) reflects the airline's dual role as both a major corporate victim of the jet fuel price surge and a bellwether for the broader economic impact on New Zealand's connectivity.
The Commerce Commission's high reach (104 items, 55.8M) reflects the significant public interest in whether fuel companies were engaging in price gouging — a concern that the Commission actively sought to address through its monitoring announcements.
Gaspy, the fuel price monitoring app, emerged as an important data source throughout the coverage, with journalists regularly citing its real-time price data to illustrate pump price movements at specific locations.
6. Summary & Key Findings
The 14-day monitoring period represents one of the most intensive and sustained episodes of fuel price coverage in New Zealand media in recent years. The following key findings emerge from the analysis:
Volume and reach were exceptional. 2,811 items generating 871.8 million audience impressions over 14 days represents a story of genuine national significance, with coverage penetrating every media type and reaching audiences across all regions of New Zealand.
Sentiment was uniformly and persistently negative. With a net polarised sentiment score of -100 on ten of fifteen days, and no day recording a positive net score, the coverage framed the Iran conflict's fuel price implications as an unambiguous threat to New Zealand households and businesses.
The AA's Terry Collins was the dominant expert voice. His consistent, accessible commentary across multiple outlets throughout the period established him as the primary authoritative source for fuel price analysis in New Zealand media.
The story evolved from pump prices to systemic economic risk. Coverage moved progressively from reporting on immediate price rises to examining inflation, freight costs, air travel, supply security, and government policy reflecting the deepening of the crisis and the broadening of its perceived economic consequences.
See how you can get more signals and insights from your media intelligence platform


